Real–Time Marine Seismic Acquisition QC
What is Marine Real–Time QC and Why Do I Need It?
Real-time QC involves onboard quality control for seismic sources and data immediately upon their receipt during marine seismic acquisition. Its primary goal is to swiftly detect any issues with seismic acquisition as they occur, enabling the seismic crew to promptly address problems, thereby minimizing operational downtime and cost. In today’s marine seismic operations, real-time QC has become the industry standard.
Typical real-time QC products encompass:
- Source control products: These include near-field hydrophone signature displays, bubble peak amplitude, time and period mapping, source towing depth monitoring, and flip-flop source identity plots.
- Data control products: This category encompasses shot gathers, near-trace gathers, SOR/EOR/TARGET RMS amplitude mapping, signal-to-noise ratio mapping, real-time 2D CMP/CSS (Common Midpoint/Common Shotpoint) stacks, and frequency plots.
This set of products is essential for keeping an eye on different aspects of onboard seismic acquisition. By monitoring these products, the QC personnel and/or observers can quickly spot our-of-spec issues like bad shots, weak or dead channels, source air leakages, flip-flop source ID inconsistencies, low signal-to-noise ratios, strong noisy interference, and more. Many of these issues require immediate action and reporting.
The software operates on a PC, reducing the processing load on your HPC server nodes. It establishes a connection to the data storage and promptly inputs a shot record as soon as it becomes available. Each shot is read only once to prevent network congestion. Once a shot is loaded into the local RAM of the PC, it is processed through predefined QC flows, all of which run concurrently locally. Real-time displays also operate and update locally, ensuring network performance remains unaffected.
This, combined with highly efficient processing algorithms, enables true real-time data QC for thousands of channels with minimal delay (typically less than half a minute). Achieving this level of performance requires just a good modern PC equipped with a multi-core CPU, a 64-bit Windows OS, and multiple monitors. This stands in stark contrast to some conventional QC packages that may claim real-time capabilities but often exhibit delays of dozens of shots, even when operating on powerful Linux clusters in practical use.
Some examples of QC products are below:
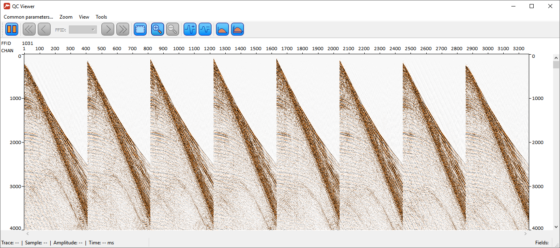
Shot gather display
Standard fully customizable shot gather display.
A user–defined number of shots can be stored in memory and reviewed during acquisition.
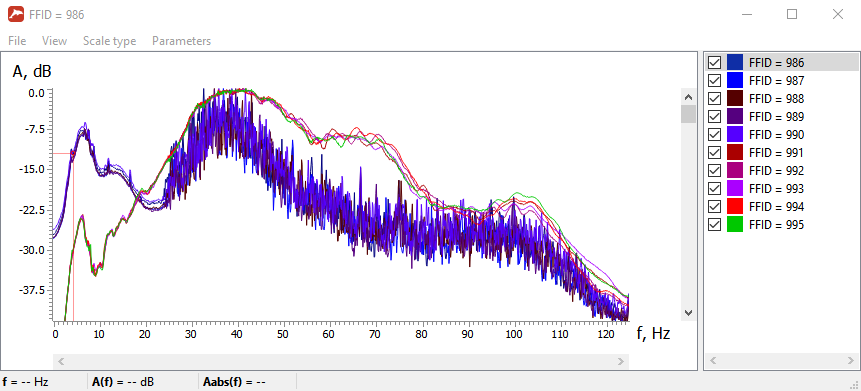
Spectrum comparison for a number of shots
Several noisy shots can be seen at the start of the profile.
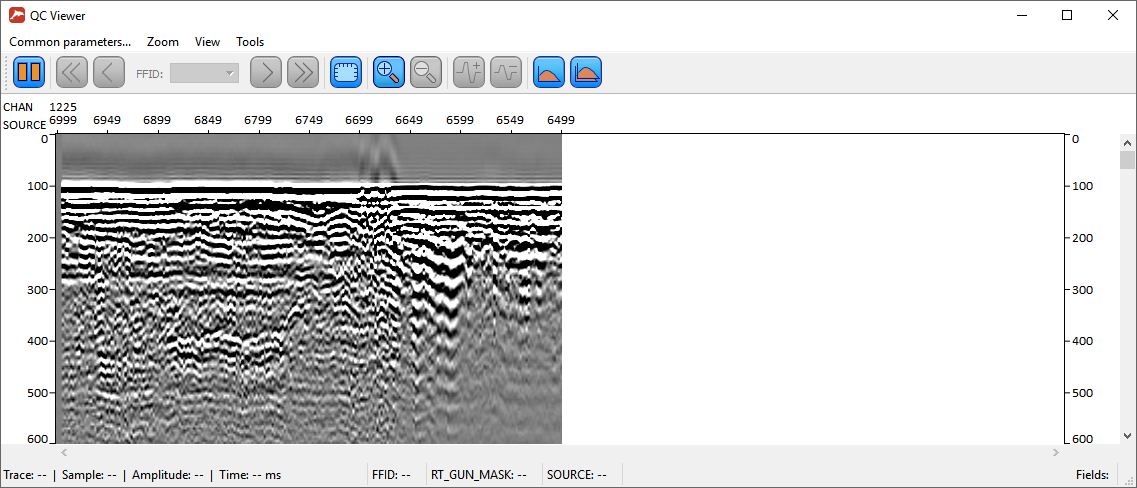
Near–trace gather display
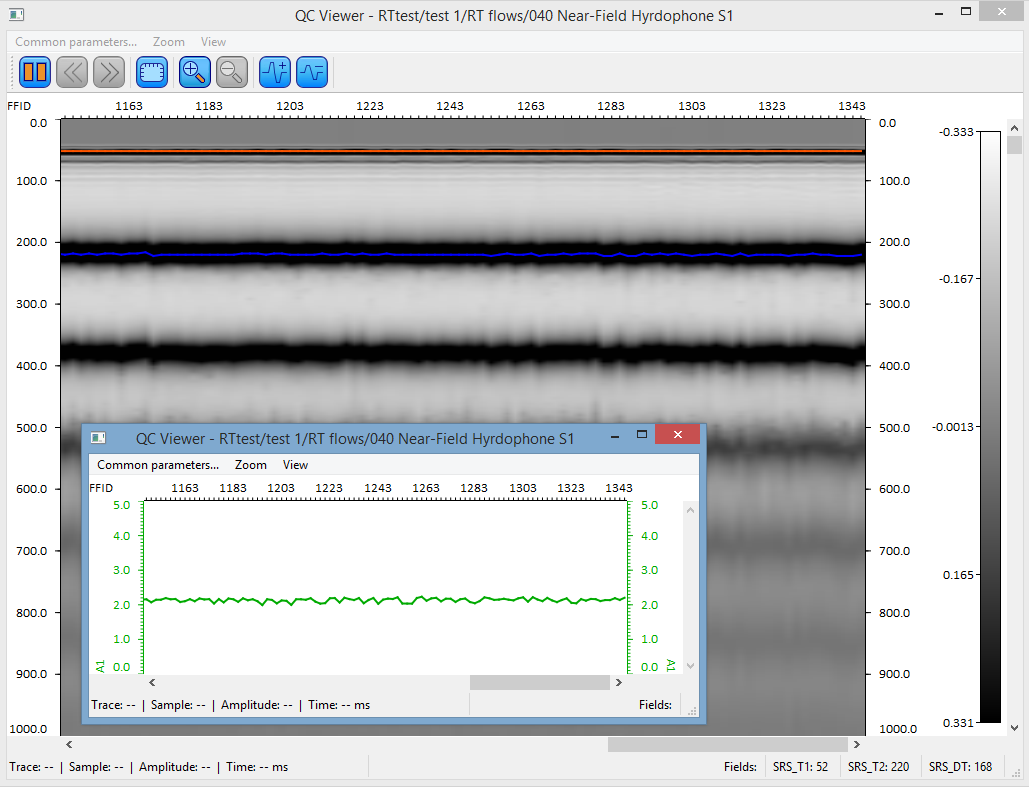
NFH signature display
Near–field hydrophone and its bubble time period graph are displayed.
RMS amplitude map
Horizontal scale is shot number, vertical—channel number. Notice purple stripes on the image. The horizontal one indicates that channel 55 is dead, the vertical one—that shot number 1360 was bad. Purple areas around channels 200–240 indicate week channels due to weather conditions. Just one amplitude map can tell us a lot about what is happening onboard!

All QC images are saved to pre–defined folders automatically after each line and stored in structured order, from where can be easily imported to an EOL report.
Furthermore, all QC results can be saved to the processing project database, to be later played back or exported into SEG–Y files.